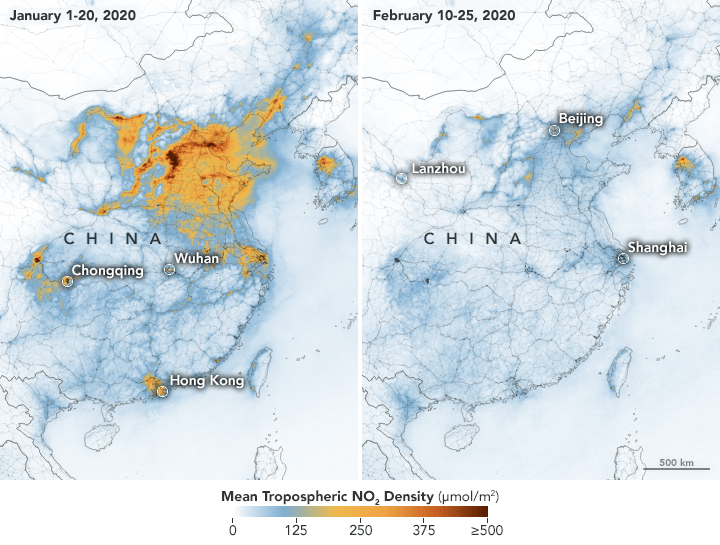
Bellow we see NO2 particles–a byproduct of industrial activity– in China before and after the onset of the SARS-CoV-2 pandemic (Figure 1).
Figure 1. NO2 concentration measured by the Tropospheric Monitoring Instrument on the ESA’s Sentinel-5 satellite.
This image is quite striking, and it has, indeed, gone around the world.
This not only shows the strength of a microscopic biological entity to partially halt the industrial and economic activity of a country such as China [1]–and, now, even world-wide (Figure 2); according to flightradar24 there are 43% less flights around the world compared to last year–but also brings up-front a less discussed climatic effect: the aerosols masking effect.
Figure 2. Flights coming in and out from Spain at 20.00pm on 13th March (left) and 20th March. Image modified from flightradar24.
Aerosols refer to a mix of particles suspended on air. They can be from natural or anthropogenic origin. Natural aerosols include volcanic eruptions, desert dust, fog, and others. Anthropogenic aerosols include haze and several industrial activity-derived pollutants; such as sulfates (SO2 ), nitrates (NO2), and others [2].
An interesting characteristic of aerosols is that they mostly cool our environment; by reflecting solar radiation and enhancing cloud-formation [3]. This effect was discovered by scientists in the early 90s [4]; their climatic models were predicting higher degrees of warming than what the real measurements showed–the answer turned out to be rather ironic: aerosols generated from industrial activity act, in fact, as climate coolers; thus, partially diminishing the end value of the complex climate warming equations.
Aerosols are short-lived–meaning they do not accumulate in the atmosphere and their effects have a short temporal window–contrary to CO2 which is long-lived, and its warming effect can last up to 200 years [5].
A study by Samset et al. modelled the global average temperature by removing the aerosol effect from the climate equation and simulating the drastic CO2 emissions reduction that would need to take place in order to reach the 1.5ºC climatic goal from the Paris Agreement.
The simulation by Samset showed that there would be an additional 0.7ºC global temperature rise in 100 years even when CO2 emissions were drastically halted. An increase in precipitations and extreme weather were also observed [6].
A more recent study simulated the effect of removing aerosols focusing on the alternative impact aerosols have in the atmosphere: reflecting sun radiation by its cloud formation ability [7]. They found that the aerosol cloud-mediated cooling effect was much larger than previous estimates. The authors concluded that their study adds up more uncertainty to past climate models as they did not effectively take into account the aerosol cloud-formation effect.
These two papers are interesting because they both focus on the two main aspects aerosols have on the environment. However, their results should be taken discretely as both of these studies work with these effects in an isolated manner and their conclusions concern those effects individually. A more informative study would be to integrate both climatic effects in the same simulations. This is, of course, quite challenging.
As we see the world greatly affected by the rapid spread of the SARS-CoV-2 virus and, as a consequence, the countermeasures global leaders are implementing; being the halt in industrial activity and passenger mobility the most important–it will not be surprising to see CO2 emissions go down (even if it is a small fraction) together with aerosol emissions. The latter ones, having a paradoxical character: on one side improving our air quality, and on the other, losing (as long as industrial activity is down) the reflecting shield against sun radiation and its concomitant climate cooling protection.
GLS
[1] Gustavo Duch, “El virus del libre mercado,” http://www.ctxt.es, 2020.
[2] NASA, “Aerosols,” Earth Obs., 2020.
[3] R. J. Charlson and T. M. L. Wigley, “Sulfate aerosol and climatic change,” Sci.Am., vol. 270, no. 2, pp. 28–35, 1994.
[4] R. J. Charlson et al., “Climate forcing by anthropogenic aerosols,” Science (80-. )., vol. 255, no. 5043, pp. 423–430, 1992.
[6] B. H. Samset et al., “Climate Impacts From a Removal of Anthropogenic Aerosol Emissions,” Geophys. Res. Lett., vol. 45, no. 2, pp. 1020–1029, 2018.
[7] D. Rosenfeld, Y. Zhu, M. Wang, Y. Zheng, T. Goren, and S. Yu, “Aerosol-driven droplet concentrations dominate coverage and water of oceanic low-level clouds,” Science (80-. )., vol. 363, no. 6427, 2019.
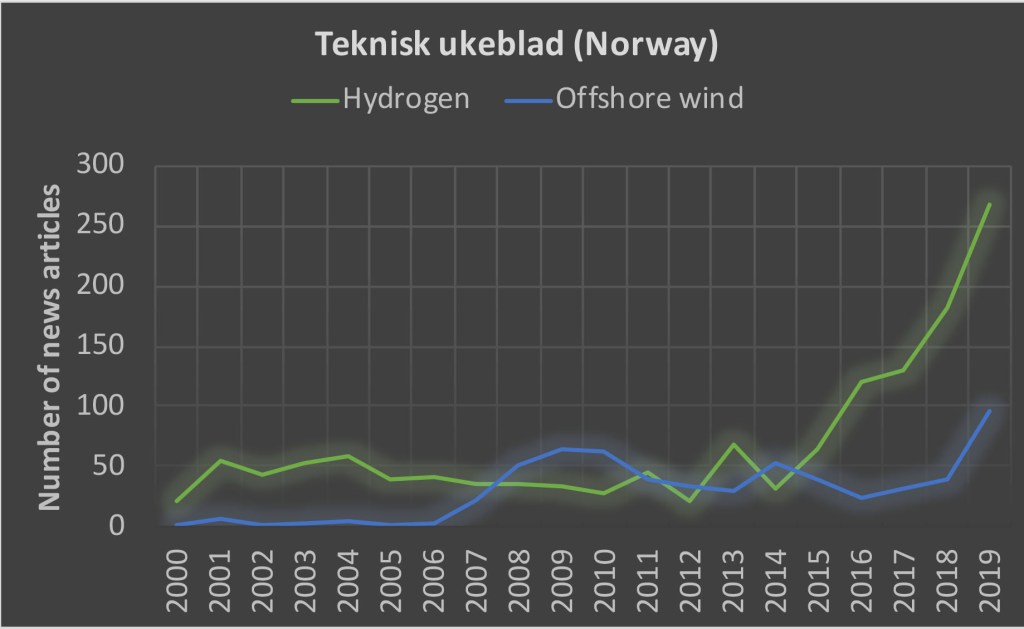
The number of published articles and funded research projects about hydrogen as an alternative energy fuel, seems to experience a growing interest in Norway within the last decade (Figure 1).
Figure 1. (Left) Articles published in tu.no–teknisk ukeblad–from 2000 to 2019. Manually counted. (Right) Granted hydrogen and offshore wind projects. Data retrieved from forskingsrådet.no
A concrete example of this general trend comes from the Norwegian shipbuilding company, Havyard, announcing a prototype for building a hydrogen-powered vessel [1].
So why is hydrogen gaining popularity, especially in Norway?
Hydrogen can be used as a fuel to produce electricity and move an electrical engine with zero GHG emissions. An additional–and important– advantage is that hydrogen can be stored and can be quickly refueled–improving the notable limitation of charging electrical batteries.
In order to generate electricity from hydrogen, a fuel cell is required. The fuel cell takes advantage of the chemical energy from hydrogen and, together with oxygen–obtained from air–,generates hydrogen ions and electrons which result in the generation of an electrical current that can then be used to produce work [2].
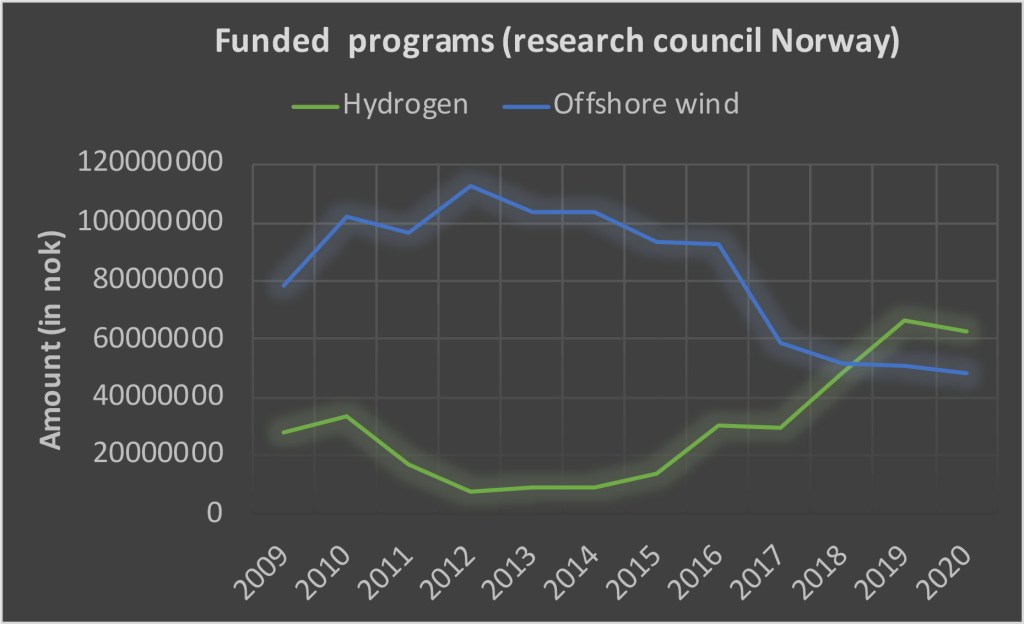
An illustrative example of how a putative hydrogen system would look like can be seen from the Havyard hydrogen-powered ferry model (Figure 2).
Figure 2. Hydrogen-powered prototype from Havyard. Image modified.
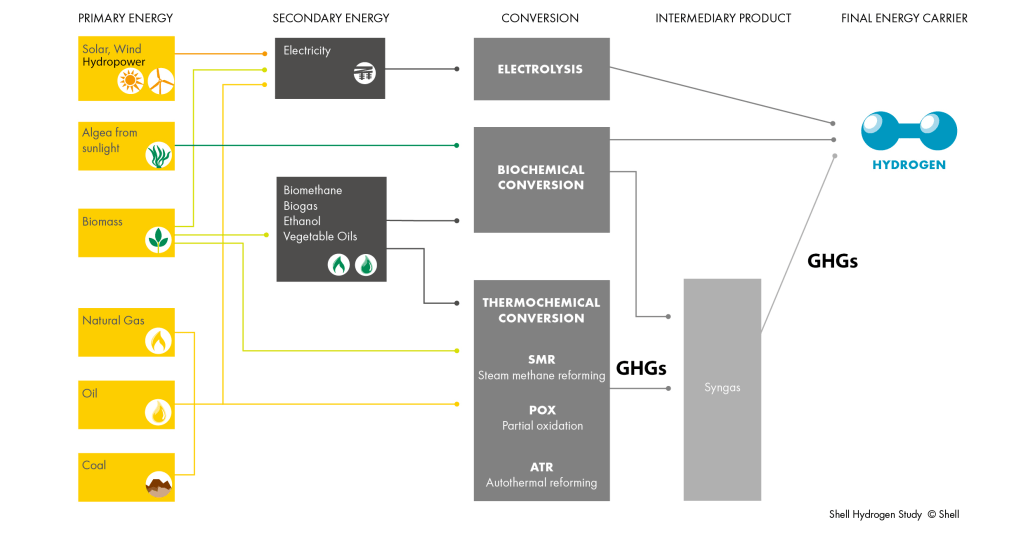
Hydrogen can be produced from several ways (Figure 3), yet the only null-GHG emission production comes from water electrolysis; consisting on splitting the water molecule (H2O) into its hydrogen and oxygen components. This process requires 50 kWh of electrical energy, approximately, to produce 1 kg of hydrogen [3] and it is seen as being a low efficiency process. This is why a famous technology entrepeneur referred to hydrogen as “bullshit” [4], as it is more efficient to directly charge electrical batteries than to use that electricity to produce hydrogen.
Figure 3. Diagram showing the different origins and steps to produce hydrogen. GHGs: green house gases. Modified
Despite Elon Musk’s blunt statement being true for the use of hydrogen in domestic vehicles, it might not be as a disadvantage for the case of maritime transport where electrical batteries are limited for i) its capacity to cover the long-distance trips cargo vessels do and ii) its long recharging times.
An interesting avenue for electricity-generated hydrogen is its coupling to renewable energy generation when there are electricity surpluses. This would be a good way for coping with the intermittent nature of renewables and not wasting electricity when it is not consumed. Surpluses in electricity can be used to produce hydrogen by electrolysis and store it for later use.
Today, however, 90% of hydrogen originates from fossil fuels–being steam reforming of natural gas the largest used method–releasing CO2 into the atmosphere. The CO2 emitted through this process is confined within an industrial framework and potentially easy to capture with the development of new technologies for Carbon Capture and Storage. Therefore, another interesting avenue for clean hydrogen production would be through the coupling of CO2 capture and storage to hydrogen production. The main challenge is to find compatible technologies that both yield high-purity hydrogen and can capture CO2 efficiently and at a reasonable cost [5]–equally important is finding suitable storage mediums for the captured carbon. Today, the main pathway appears to be oil and gas reservoirs [6]. This is already done to increase the reservoir pressure and thereby increasing the yield of oil or gas.
An issue concerning hydrogen is its storage; as hydrogen is a very low-density gas and therefore requires compression and other specialized forms of storage (such as liquefaction) to achieve desired energy densities. This also represents another energy loss to the energy cost of compression.
Hydrogen is also highly flammable; startling examples of the past [7] and others more recent [8] exemplify this intrinsic characteristic. Therefore, care should be taken when designing hydrogen infrastructure.
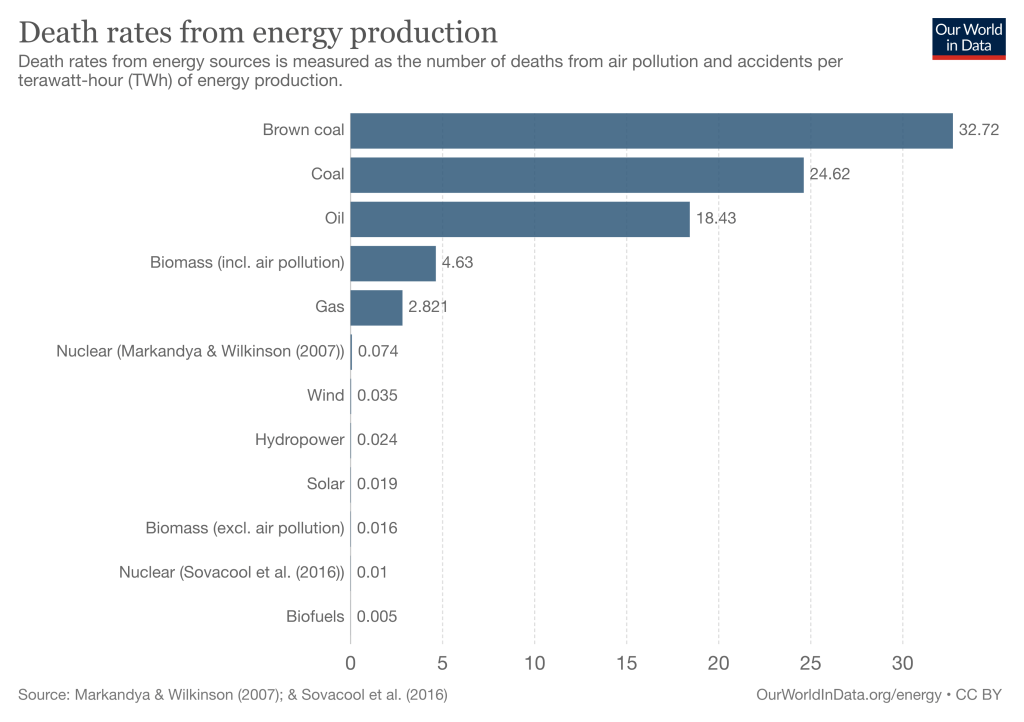
A transition to renewable energies not only concerns peak-oil and climate change but also public-health: fossil fuels (coal and oil, in particular) are the highest sources among deaths by air contamination per TWh of energy produced (Figure 4).
In Norway, the high traffic of diesel-driven ferries cruising the western fjords has resulted in strong local air and water contamination [9].
Figure 4. Death rates by air-pollution per TWh energy production shown for different energy sources.
A shift towards clean energies not only implies an improvement in air quality–as in this example–but in all the elements of the ecosystems we live in; with a direct impact on human health.
Overall, Norway seems, again, to be in the avant-garde of the renewable energy transition; betting heavily for all possible paths towards a more environmental-friendly future.
[3] R. Bhandari, C. A. Trudewind, and P. Zapp, “Life cycle assessment of hydrogen production via electrolysis – A review,” J. Clean. Prod., vol. 85, pp. 151–163, 2014.
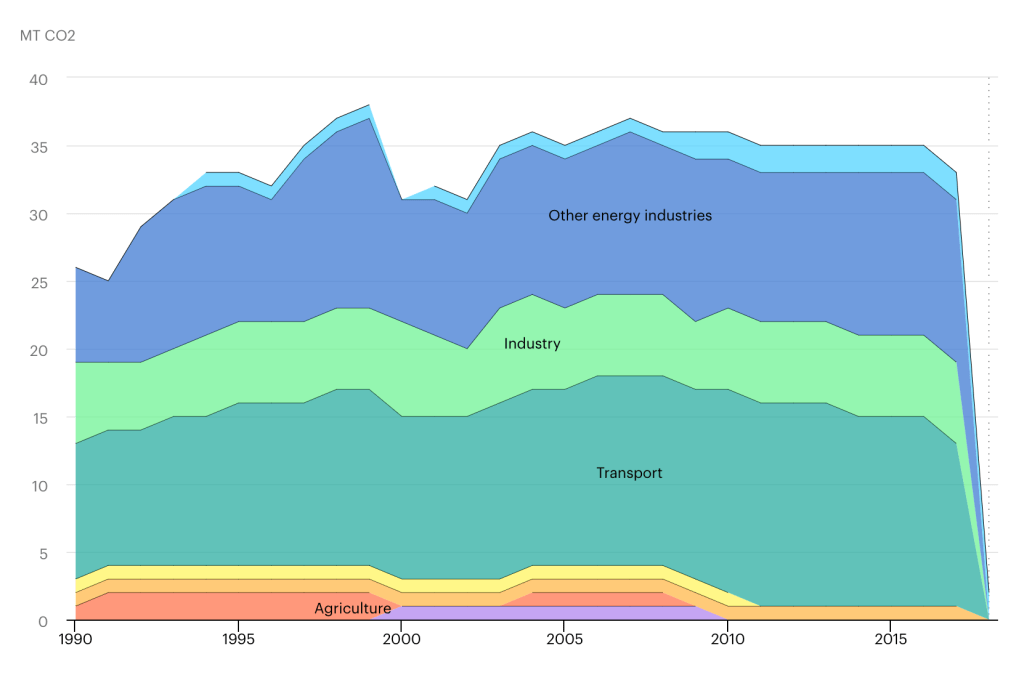
As stated in the website of the Norwegian climate and environment department; Norway’s government is committed to reduce by 40% its greenhouse gases (GHG) emissions by 2030–today being slightly below 35 million tons of CO2[1] (Fig.1)–and reach almost carbon-neutrality by 2050 [2]. This means that Norway will have to reduce 14 million tons of its CO2 emissions by 2030.
Figure 1. Total CO2 emissions by sectors from Norway as shown from the IEA.
The Norwegian energy consumption profile by sectors and energy source looks like this (Fig. 2):
Figure 2. Total energy consumption from Norway as shown from the IEA by sectors (up) and energy source (down).
The question that arises, therefore, is how does Norway plan to achieve this ambitious–yet necessary–goal? The strategy, on paper, seems clear: to reduce the consumption of carbon-emitting combustibles. However, in today’s heavily energy-dependent economy and society, this is not so easily achievable.
Renewable energies, therefore, are set to play an important role for achieving the required reductions in GHG emissions.
Norway’s hydrological resources together with a small population makes it the top-one country in relative hydroelectricity consumption–that is; nearly all electricity consumed in Norway comes from clean-energy (hydropower) production.
In 2018, Norway produced 144,1TWh of electricity from hydropower and consumed 122,2TWh from its 244TWh total yearly energy consumption [3], [4]–fossil fuels providing the remaining energy share. The renewable energy growth, thus, must close the gap as well as cover the significant fraction of energy produced by non-renewable combustion (Figure 2) together with the expected growth in energy-need for the next decade.
This requires improvements on multiple fronts. From obvious green initiatives such as introduction of additional renewable energy, to light- green initiatives where we only reduce the GHG emissions by changing to less GHG emitting energy forms; such as from coal to gas.
Equinor, the Norwegian oil company (known before as Statoil), recently announced the discovery of a new oilfield (named Johan Sverdrup) 140km from the west-coast of Norway [5] and stated, at the same time, to be committed to meet the climate goals of Norway by claiming to exploit this new oilfield using renewable-generated electricity–in contrast to the previous gas-powered offshore platforms–thereby, reducing their emissions in oil-extraction.
It is not clear, though, i) how many of Equinor’s oil-platforms will be run by renewable-energy generated electricity, ii) if Norway has enough electricity capacity/potential to power all of its oil-exploitations with CO2-null emitting technologies and last iii) if the total net global balance of CO2 will actually be reduced.
Of these, the latter question is perhaps the most interesting and has been thoroughly investigated in the literature [6]. The general conclusion is that a significant net- positive effect heavily depends on the origin of the replacement power (electrical).
With this, we must distinguish the following scenarios: at the national level, emission reductions are greater due to the high fraction of renewable energy (hydroelectricity) in the norwegian electrical grid. However, the local offshore emission savings are shifted abroad as the electrification of local platforms will reduce the access of total hydroelectrical power in the common electrical grid (Europe, in this case). As such, the overall net- reduction is significantly less compared to the national reduction and is generally limited to the difference in the averaged CO2 emissions/kWh from the European energy mix (approximately 270g CO2/kWh [7]) and the emissions from the less efficient on-site offshore gas turbines. Additionally, one must account for the electrical losses associated with transmission when the electrical generation is off-site.
This is well represented in Figure 3 which describes the life-time CO2 emissions- both national and overall in the context of electrification of the Dagny and Draupnel/Luno project in Norway (taken as an illustrative example).
Figure 3. CO2 emissions over time in different scenarios. Modified from [6].
An additional point is the effect of increased gas export. If oil and gas companies now power themselves with renewable-generated electricity or from the electrical grid, they will, in theory, have a surplus of oil and gas to sell in the energy market; it can be speculated that the increased access to gas will reduce its price and thereby displace coal energy in the common European market. This principle, however, becomes less true as coal is phased out from the energy market and renewables phased in. Despite this, it should be noted that shifting the emissions associated with electrical power generation from an offshore gas turbine to an onshore high efficiently gas power station will contribute to a net-positive effect.
All in all, there are multiple factors influencing the global energy market and its derived CO2 emissions.
For the case of Norway meeting its future climate goals; they ought to obtain energy from other null-emitting technologies such as wind-power generation or an optimal combination of the strong and weak points of the different renewable-technologies (which we hope to explore in future posts).
The number of climatic and natural disasters is on the rise; the Australian fires caught the world eye not only for its magnitude in extension–greater than the Amazonas fires–but for the tremendous ecosystem loss; recently, an unusual strong storm hit the Catalan coast-line in Spain causing several material and natural damages. We are, therefore, faced with the challenge of designing better and more environment-respectful strategies and technologies which will require a global common effort.
GLS
References
[1] IEA, “International Energy Agency.”
[2] K. Miljødepartement, “Klimastrategi for 2030 – norsk omstilling i europeisk samarbeid,” vol. 41, 2017.
[3] Olje- og energidepartament, “Energi Fakta Norge.”
Dozens of climate scientists, energy experts, policy makers, ecologists, engineers, economists etc. gathered at the climate summit COP25 held in Madrid launched by the United Nations Climate Change initiative on December 2019 in order to find solutions to mitigate the anthropogenic climate change[1]–[4].
Recently, the World Meteorological Organisation (WMO) has released its provisional 2019 global climate report where it concludes that temperatures are on an increase rise since the1980s and that the past decade, 2010-2019, has been the warmest on record [5].
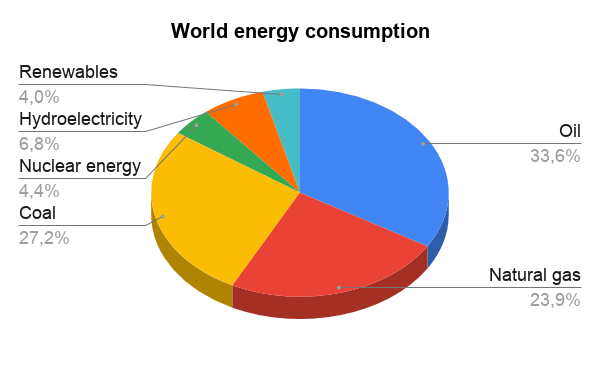
Since the 1850s, approximately, humans began using fossil fuels as their primary energy source to power their activities. Today, fossil fuels (coal, oil and gas) represent an 85% of the total global energy consumption (Fig. 1) [6]. The combustion of hydrocarbons releases CO2 into the atmosphere which results in the so-called green-house effect. The progressive accumulation of CO2 (and other green-house gases) in the atmosphere–today at approx. 410ppm [7]–is the main cause of the global temperature rise.
Figure 1. Pie diagram of world total energy consumption in 2018. Data taken from [6].
Therefore, a need for a shift towards other energy sources that do not release CO2 into the atmosphere is needed to mitigate and, ultimately, halt the impacts of climate change.
At the same time, live (both human as well as all others forms of live) is dependent on and takes place within a framework–the biosphere. Any human technological deployment will interact with the local surrounding and result in greater or lesser environmental impacts.
It is, thus, fundamental, to evaluate the environmental impacts a given technology will entail and carefully consider the relation between the gains it provides (energy produced) versus the inherent losses (environmental impact, pollution…).
Floating solar-panels emerge as a novel alternative technology in substitution of fossil fuels for energy production [8] yet little is known about the environmental impacts of this technology. The aim of this work is to serve as a critical starting point to set the stage for future studies assessing the environmental footprint of floating solar panels.
Floating solar panels
Technology
Floating solar-panels are in essence the same as classical solar-panels with the difference of being located on a water body (mainly in inland water reservoirs) instead of on land.
Solar panels make use of the photovoltaic reaction where they generate electricity from sunlight; as no combustion reaction is involved in the generation of electricity and, thus, no CO2 is emitted, this technology belongs to the so-called clean energies.
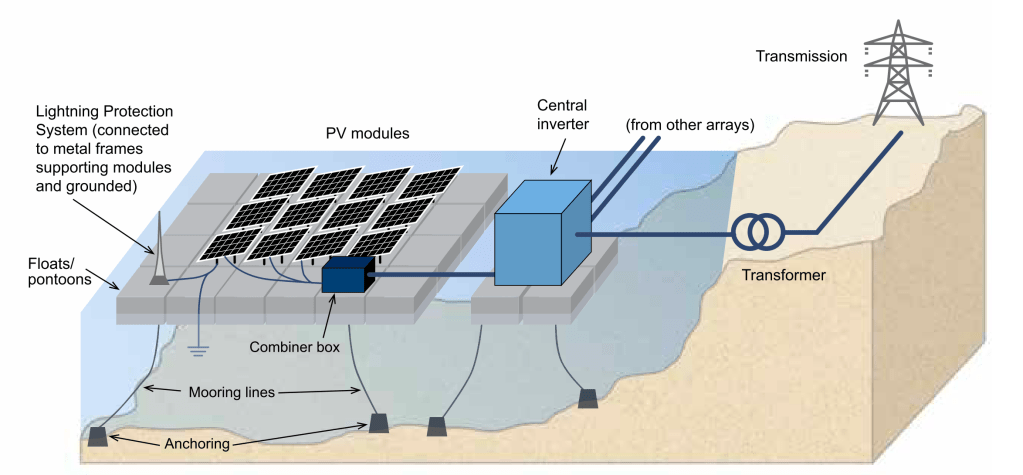
A typical floating photovoltaic (FPV) system consists of the photovoltaic panels and a central inverter mounted on floating platforms at the surface of a water body connected by cables to the anchoring points at the bed of the water body (Fig. 2).
Figure 2. Schematic diagram of a floating photovoltaic power system. Image taken from [8].
Energy and scale
Over the recent years renewable energy such as solar and wind powered electrical generation have seen significant growth. Forecasts for the imminent years [9] continues as shown in Figure 3:
Figure 3. Historical (2004-2018) and forecast (2019-2023) values for solar and wind powered energy production (TWh). Values for 2025 and 2030 (SDS) corresponds to the required values in order to maintain a 50 % probability of limiting the global temperature rise below 1.5°C envisioned by [9].
Two parameters need to be considered in order to understand the scale at which photovoltaic energy will be used; the potency we can obtain from a PV system and the surface area we will have to cover in order to achieve a specific potency.
By adopting an average land requirement factor of 0.0146 km2 /GWh/ year[1]–extracted from the IEA and other solar-energy companies–we can estimate the total land requirements (Fig.4) for fulfilling the envisioned solar PV electricity generation given in Figure 3. The 2030 projection indicates a land requirement of almost 50,000 km2; approximately corresponding to the combined surface areas of Catalonia and Valencia regions in Spain. This land requirement is also the driving force for introduction of floating solar. This is also, in part, the same driving force for the emergence of offshore wind generated power–another clean energy alternative.
Figure 4. Land surface requirements of solar energy production.
As the above figure values indicate; large surface areas will have to be covered by solar panels if we want to substitute today’s global energy consumption by CO2-null energy production. In order to absorb the 10 TWh electricity generated by coal in 2018, for example, the surface requirement is expected to exceed 145,000 km2.
It is important to notice that to achieve this transition, a large deployment consisting of obtention of materials, assembling, transportation and final installation will have to take place and would probably be fuelled–at least at the early stages–by CO2-emitting combustibles.
Effects on biodiversity/ecosystems
Based on the surface area estimations and the deployment magnitude needed to be covered by solar panels; we distinguish two scenarios of environmental impact: indirect and direct.
The assessment of the indirect environmental impacts is out of the scope of this work; we will, nevertheless, highlight them: these concern floating solar panel production; distinguishing the following phases: material extraction, components assembly and transport.
At the direct scenario we consider the environmental impacts that affect the deployment per se of this new technology. We have compiled the environmental impacts of the Da Mi Reservoir floating solar PV power plant at Vietnam [10] and compared them to those identified for offshore wind energy [11] (Table 1); including the following phases: construction/decommissioning and operational.
Table 1. Assessment of environmental issues concerning floating-solar and wind energy. Adapted. *Note that this evaluation originates from two different studies with different assessment criteria. Here we use them as an illustrative example to highlight the main advantages/disadvantages of these technologies.
Despite of the lack of a large collection of supporting data, some conclusions can be inferred from floating-solar. Due to the intrinsic characteristics of this technology, floating solar is a less environmental-invasive technology compared to offshore wind farms: its structure consists of flat solar-panels floating at the surface of a water body, therefore, having a small interaction impact with the local environment; its anchoring to the bed of the water body is also minimal, as no large heavy structures need to be anchored to it; and its energy generation capacity is noise-free, as no turbines are involved.
Even though floating-solar does not require invasive environmental action–some environment impacts will take place and should be highlighted: at the construction phase, a degree of sediment dispersion and local habitat loss/dispersion is probable; spills of toxic substances should not be discarded as well as a possible entry source of invasive species.
At the operational phase, changes in the local aquatic community structure might take place. Another issue (not assessed in the Da Mi report) is the electromagnetic field generation from sub-water power cables; sub-water cables are known to require intimate contact with the bed of the water body and the electromagnetic field emanated from those might interfere with the local organic communities [12].
Two important environmental factors that specifically concern floating-solar technology are the sunlight and gas-exchange blocking effects a large deployment of floating solar-arrays will pose to the aquatic ecosystem.
Light is essential for photosynthesis in plants and it is a cue for daily and seasonal physiological rhythms for both plants and animals [13]. Furthermore, light is a key factor on the sustainability of food webs as it constitutes the primary energy source for autotroph organisms–which are at the base of the trophic chain. Additionally, sunlight influences the water temperature which is, in turn, another important factor of an aquatic ecosystem [14].
Gas exchange (oxygen, carbon-dioxide, water evaporation and other volatile components) takes place between the water-air interphase and constitutes another important factor for the maintenance of aquatic ecosystems [14]. Oxygen, for example, is an indispensable requirement for all aerobic organisms (which are the majority of freshwater species) and its intake comes from diffusion from the atmosphere and release by photosynthetic organisms. Carbon dioxide, together with light, are important components for photosynthesis.
Discussion and conclusion
The two reviewed reports show mainly minor impacts to the aquatic ecosystem (with a few moderate exceptions) for both offshore wind and floating solar. Despite of their environmental assessments being mostly correct and floating solar showing minor effects than offshore wind; an important remark should be made: the small environmental impact of these technologies is largely dependent on the magnitude dimension of the project. That is, minor environmental impacts can be achieved as long as these installations remain relatively small in size in relation to the ecological system they will be part of.
A limiting issue that these two reports–and other studies on the environmental viability of floating solar [15]–show is the lack of proper estimations on the cumulative effects minor environmental issues will pose on the environment over long periods of time.
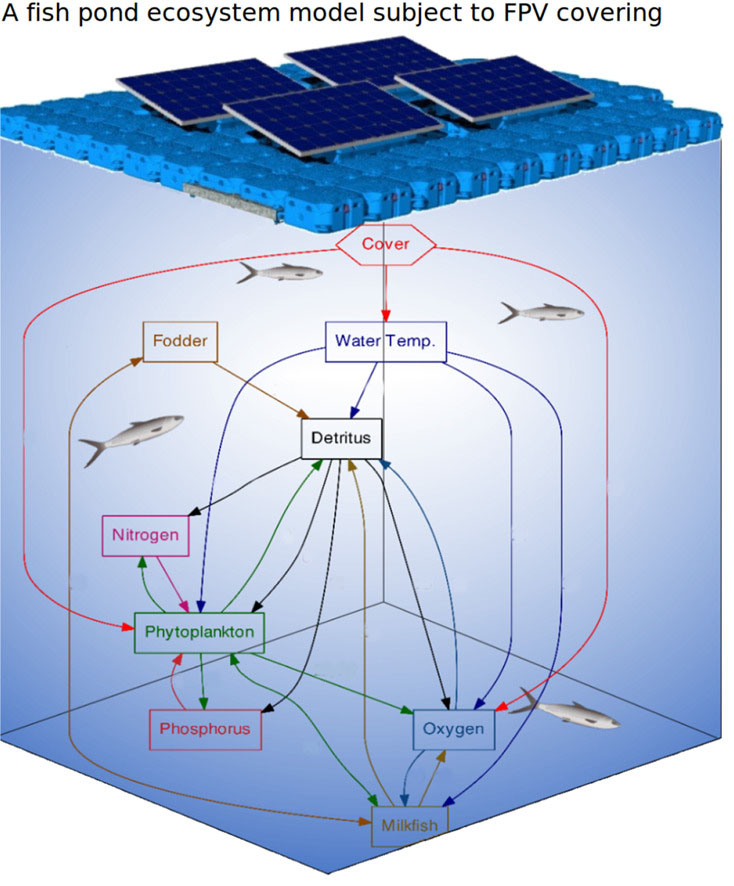
For example, in their study, Château et al. performed a mathematical analysis where they compared different FPV coverage–20%, 40% and 60%–and assessed the ecosystem change. According to their mathematical model, they conclude that it is possible to cover up to 60% of the water body and still maintain a 70% of fish production [15]. However, it is important to notice that they calibrated their computational model using experimental data from a pond with no cover and a pond with a 40% cover in southern Taiwan. Importantly, and as aforementioned, their experimental collection data was done over the period of one year.
Ecosystems are the sum of multiple factors–greater than the ones highlighted here– that show complex relations impacting each other which, in turn, contribute to the maintenance of a stable ecosystem. Changes in one of these factors (Fig.5) might alter, in the long-term, the ecological state of an aquatic ecosystem into a different one. It is within a specific ecological state that humans (as well as other animals) have evolved on Earth between 300.000 [16] and 6.000 years (according to other sources [17]) ago. Therefore, robust environmental monitoring and assessment of the long-term effects floating-solar poses on aquatic ecosystems should be undertaken.
Figure 5. Floating solar aquatic ecosystem web. Image taken from [15].
References
[1] S. Arrhenius, “In the Air upon the Temperature of the Ground,” Philos. Mag. J. Sci., 1896.
[2] H. E. S. Roger Revelle, “Carbon Dioxide Exchange Between Atmosphere and Ocean and the Question of an Increase of Atmospheric CO2 during the Past Decades,” Tellus, 1957.
[4] C. Rosenzweig et al., “Attributing physical and biological impacts to anthropogenic climate change,” Nature, vol. 453, no. 7193, pp. 353–357, 2008.
[5] W. M. Organization, WMO provisional Statement on the Status of the Global Climate in 2019, vol. 1961, no. September. 2019.
[6] D. Spencer, “BP Statistical Review of World Energy Statistical Review of World,” Ed. BP Stat. Rev. World Energy, pp. 1–69, 2019.
[7] and H. A. M. C. D. Keeling, S. C. Piper, R. B. Bacastow, M. Wahlen, T. P. Whorf, M. Heimann, “The Keeling Curve,” 2019.
[8] SERIS, “Where Sun Meets Water – Floating solar market,” Where Sun Meets Water, 2018.
[9] IEA, “Tracking Power,” 2019.
[10] Asian Development Bank, “Initial Environmental and Social Examination Report: Da Mi Hydro Power Joint Stock Company Floating Solar Energy Project,” Report, no. October, 2018.
[11] D. Wilhelmsson et al., Greening Blue Energy: Identifying and managing the biodiversity risks and opportunities of offshore renewable energy. 2010.
[12] M. S. Bevelhimer, G. F. Cada, A. M. Fortner, P. E. Schweizer, and K. Riemer, “Behavioral responses of representative freshwater fish species to electromagnetic fields,” Trans. Am. Fish. Soc., vol. 142, no. 3, pp. 802–813, 2013.
[13] C. J. Krebs, “Ecology. The Experimental Analysis of Distribution and Abundance,” Q. Rev. Biol., 1973.
[14] C. Brönmark and L. A. Hansson, The biology of lakes and ponds. 2017.
[15] P. A. Château, R. F. Wunderlich, T. W. Wang, H. T. Lai, C. C. Chen, and F. J. Chang, “Mathematical modeling suggests high potential for the deployment of floating photovoltaic on fish ponds,” Sci. Total Environ., vol. 687, pp. 654–666, 2019.
[16] E. Callaway, “Oldest Homo sapiens fossil claim rewrites our species’ history,” Nature, 2017.[17] The Bible, The Book of Genesis.
[17] The Bible, The Book of Genesis.
[1] This value represents the average total land requirement per annually GWh produced electricity for solar PV plants in the US [2].